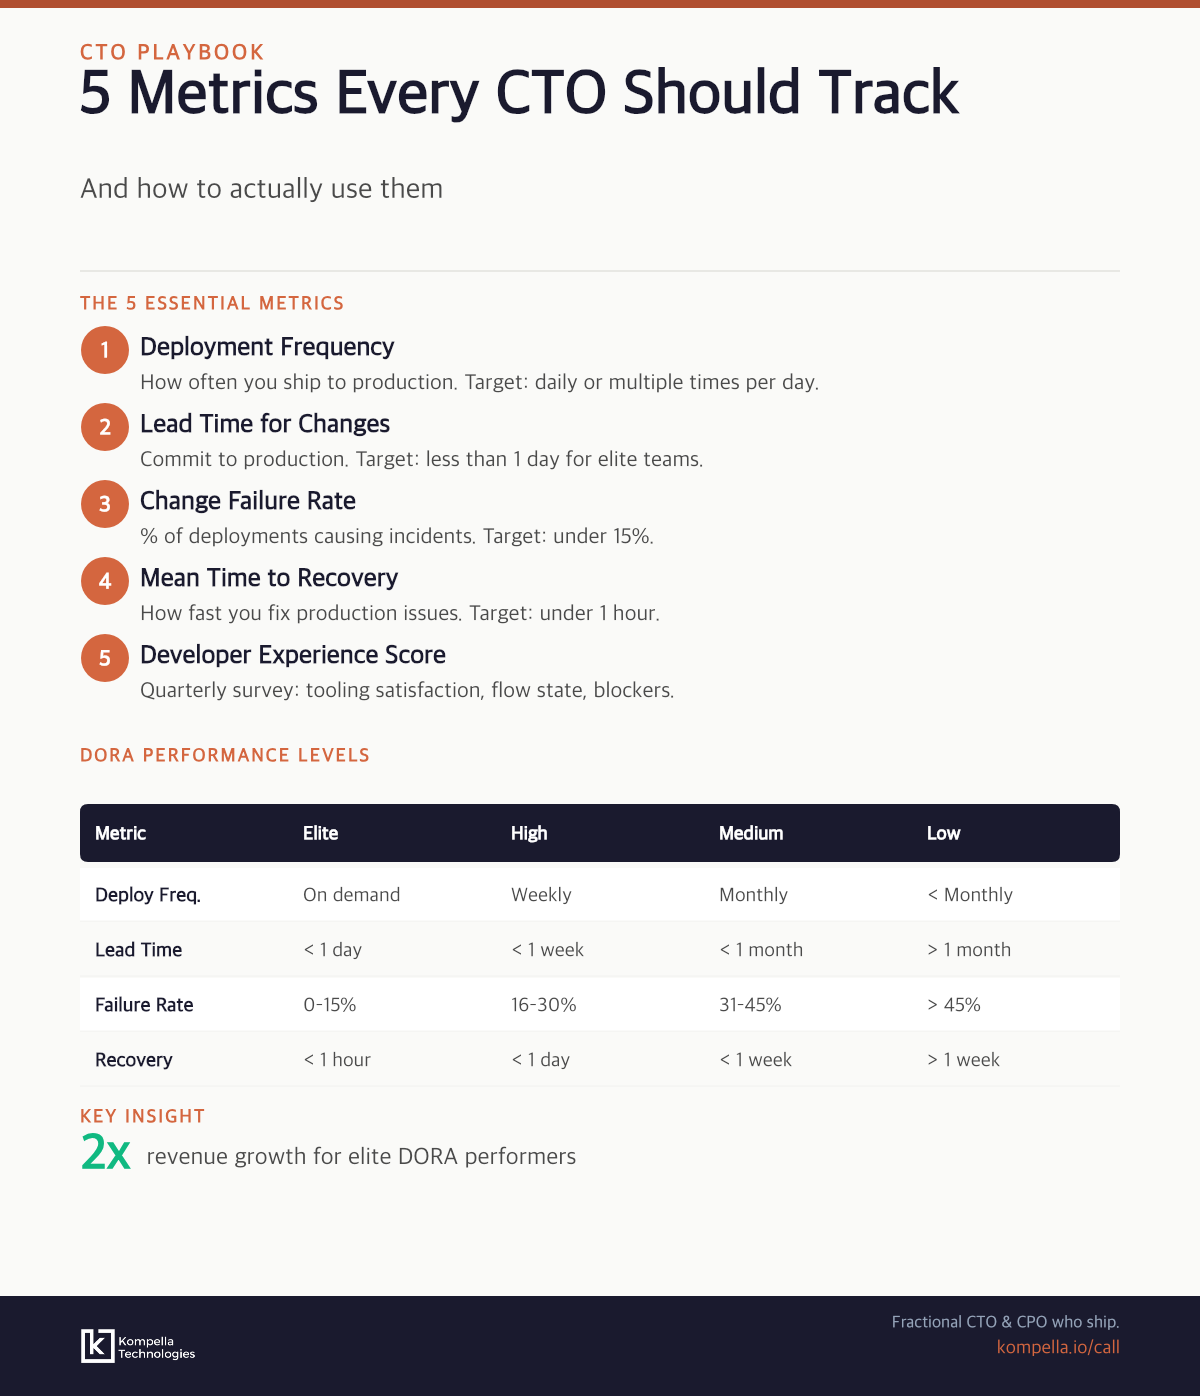
The 5 metrics every CTO should track are deployment frequency, lead time for changes, mean time to recovery (MTTR), change failure rate, and developer experience. Here's how to implement and use them.
When I took my first CTO role at a Series A startup, I made one of two mistakes every CTO makes: I either wasn't measuring anything at all, or I was drowning in metrics. No in-between.
The first year, we had zero visibility into how fast we shipped. We'd hit production bugs monthly and had no idea if we were getting faster or slower. The second year, I built a dashboard with 47 metrics. It was beautiful. Nobody looked at it.
Here's what I've learned: you don't need 47 metrics. You don't need zero. You need exactly 5 — and you need to understand what each one actually tells you about the health of your engineering organization.
This framework is based on DORA metrics (Google's research on what separates elite-performing teams from everyone else) plus one metric I've added from experience: developer experience. These five metrics have become the backbone of how I advise CTOs across 30+ startups.
Why Do Vanity Metrics Fail CTOs?
Before we talk about the right metrics, let's be clear about which ones will destroy your decision-making.
Lines of code: This one haunts me. I've seen teams celebrate shipping 50,000 lines of code. Meanwhile, the actual outcome was slower deployments and more bugs. Code is a liability, not an asset. You want less code that does more.
Story points completed: Agile coaches will hate me for this, but sprint velocity numbers are activity metrics, not outcome metrics. A team could complete 100 points and ship nothing. Or complete 40 points and drive 10x more revenue impact. The former feels productive. The latter is productive.
Number of commits: Engineers love this one because it looks objective. But I've seen the same commit made 14 different ways by 14 different developers. Commit frequency is not velocity.
Uptime percentages: This is a tricky one. Obviously you care about uptime. But CTOs tell me they're hitting 99.95% uptime while customers are furious about slow deployments. Uptime alone doesn't tell you if you're shipping features quickly or if your pipeline is broken.
The pattern: these metrics measure activity. Real metrics measure outcomes. You need to know whether your engineering organization is getting healthier, faster, and more capable of shipping valuable features — not just busier.
What Are the 5 Essential Metrics Every CTO Should Track?
Here are the five metrics I recommend every CTO track. The first four come from the DORA research. The fifth I've added because it's the leading indicator that predicts improvements in the other four.
Metric 1: Deployment Frequency
What it measures: How often you ship code to production.
Target benchmarks:
- Elite performers: Multiple deployments per day
- High performers: Daily deployments
- Medium performers: Weekly deployments
- Low performers: Monthly or less frequent
This metric has a hard ceiling: you cannot ship faster than your pipeline allows. If you're stuck at weekly deployments, it doesn't matter how talented your engineers are — something in your process is bottlenecking you.
How to measure: Look at your CI/CD logs. Count production deployments per week. It's dead simple.
Watch for: Deployment frequency dropping is often the first red flag that something else is breaking. Either your codebase is becoming harder to change, your testing is getting slower, or your team is context-switching too much.
Metric 2: Lead Time for Changes
What it measures: Time from code commit to production deployment.
Target benchmarks:
- Elite performers: Less than 1 hour
- High performers: 1-24 hours
- Medium performers: 1-7 days
- Low performers: Weeks or months
Short lead time means:
- Bugs are caught and fixed quickly
- Features get feedback from real users fast
- Your CI/CD pipeline isn't a bottleneck
- Developers aren't waiting around for deployments
Metric 3: Mean Time to Recovery (MTTR)
What it measures: How long it takes to fix a production incident and restore service.
Target benchmarks:
- Elite performers: Less than 15 minutes
- High performers: Less than 1 hour
- Medium performers: 1-6 hours
- Low performers: Hours to days
If you can ship multiple times per day but take 8 hours to fix an outage, customers are angry. If you ship once a week but fix incidents in 15 minutes, customers trust you.
How to measure: Track your last 10 production incidents. For each, note the time when the incident was first detected and the time when service was restored. Calculate the median.
Watch for: MTTR increasing over time usually means your system is becoming harder to debug. It's a sign that you need to invest in observability.
Metric 4: Change Failure Rate
What it measures: Percentage of deployments that result in degraded service, incidents, or rollbacks.
Target benchmarks:
- Elite performers: 0-15%
- High performers: 15-30%
- Medium performers: 30-45%
- Low performers: Above 45%
If your change failure rate is above 30%, it means roughly every third deploy causes problems. That's a code quality issue, a testing issue, or a deploy process issue. Either way, you're not ready to increase deployment frequency.
How to measure: Track every deployment for one month. Note which ones caused incidents, degraded performance, or required rollbacks. Divide the number of problem deployments by total deployments.
Watch for: Change failure rate creeping up over time. This usually happens when you add new engineers or rush to hit deadlines. It's a sign you need to slow down before you can speed up.
Metric 5: Developer Experience Score
What it measures: How easy and productive is it for engineers to build, test, and deploy?
Target benchmark: 7/10 or higher (quarterly survey)
Why it matters: The first four DORA metrics are outcomes. Developer experience is the input. It's the leading indicator.
If your developers hate the build process, testing takes forever, or deploying feels risky, they'll naturally go slower. They'll take longer to review code. They'll avoid refactoring. Everything slows down.
Great developer experience means:
- Local dev environment is easy to set up (< 15 min)
- Running tests locally is fast (< 2 min for unit tests)
- Deploying feels safe (good monitoring, easy rollbacks)
- Getting help is easy (good runbooks, responsive infrastructure team)
- The codebase is organized and navigable
- "How easy is it to set up your local environment?"
- "How long does it take to run the full test suite?"
- "How confident do you feel deploying to production?"
- "How easy is it to understand the codebase?"
- "How responsive is the infrastructure/platform team?"
What's DORA and Why Do These Metrics Matter?
DORA stands for DevOps Research and Assessment. In 2018, Google published research on 460+ teams across different industries and found that four metrics separated elite-performing teams (shipping multiple times per day, recovering from incidents in minutes) from low-performing teams (shipping once per quarter, recovering in weeks).
The research is rigorous. It's been replicated across industries. These aren't made-up metrics — they're based on data about what actually separates high-performing engineering organizations.
The four DORA metrics (deployment frequency, lead time, MTTR, change failure rate) are table stakes. If you're a CTO and you're not tracking these, you're flying blind.
I added the fifth metric — developer experience — because in early-stage startups, developer experience often becomes the bottleneck. You can't improve DORA metrics if your developers are frustrated.
How Do You Start Implementing Engineering Metrics?
Don't try to measure all five at once. Here's the roadmap I recommend:
Month 1: Deployment Frequency This is the easiest to measure and the most immediately actionable. If you're deploying weekly, make it twice weekly. If daily, move toward twice daily. This one metric will improve everything else over time.
Month 2-3: MTTR Start tracking your incidents and how long recovery takes. This requires building an incident tracking process, but it's worth it. Focus on cutting recovery time in half over the next quarter.
Month 4: Lead Time for Changes Now that deployments are more frequent and incidents are faster to recover, measure the time from commit to production. This is often where automation investments pay off.
Month 5: Change Failure Rate Start tracking which deployments cause problems. This data gets uncomfortable quickly. You'll realize some teams are shipping broken code, or that certain types of changes are risky. That's the point. Now you can fix it.
Ongoing: Developer Experience Run a survey every quarter. This one doesn't require new infrastructure — just 5 minutes of your team's time. Track the trend.
How Do You Present Engineering Metrics to Your Board?
Here's a common problem: engineers talk deployment frequency. Boards talk uptime and time-to-market. You need to translate.
When a board member asks "What's our uptime?" say: "Our MTTR is 45 minutes, which means when something breaks, we're back up fast. That's how we maintain high uptime even though we deploy daily."
When they ask "How fast are we shipping?" say: "Our deployment frequency is 12 times per day, and 95% of those deployments are successful. Our lead time from feature request to production is 8 hours."
When they ask "Why are we slower than competitors?" say: "Our lead time is 2 days because our change failure rate was 35%. We're investing in testing infrastructure this quarter to get it below 15%, which will let us deploy safely faster."
The board doesn't care about deployment frequency in the abstract. They care that you're shipping features fast, reliably, and safely. DORA metrics prove you're doing that.
Which Metrics Matter at Each Company Stage?
You don't need to track all five metrics at every stage. Here's what I recommend:
| Stage | Focus | Rationale |
|---|---|---|
| Pre-seed | Just ship | You have 2 engineers. Measuring is overhead. |
| Seed | Deployment frequency only | You need to validate product-market fit fast. Speed matters. |
| Series A | All 4 DORA metrics | You're hiring. You need to understand what "fast" looks like. |
| Series B+ | DORA + DX score + cost per transaction | You're scaling. You need both speed and efficiency metrics. |
Red Flags to Watch
Every CTO should have alerts on these:
1. Deployment frequency dropping: Usually the first sign something's wrong. Either your team is burned out, or your codebase is becoming harder to change. Investigate immediately.
2. MTTR increasing: Your team is losing knowledge about how the system works, or your observability is poor. This gets worse over time if you ignore it.
3. Change failure rate above 30%: Your engineering practices aren't ready for your deployment frequency. You need better testing, better code review, or better deploy processes.
4. Developer experience score below 6: Your team is frustrated. Turnover is next. Fix this before it becomes a crisis.
5. Lead time exploding: Your CI/CD pipeline is the bottleneck. Probably needs optimization or better tooling.
Final Thought
Metrics are not about measuring your team. They're about understanding your system.
Every CTO role I've taken on has felt overwhelming at first. There's too much code, too many engineers, too many decisions. But when you track these five metrics, suddenly the picture clears. You see where the bottleneck is. You see where engineers are frustrated. You see what's actually getting better.
Start with deployment frequency. Add one metric every month. Within three months, you'll have better visibility into your engineering organization than most CTOs get in years.
The teams that move fastest aren't the ones with the smartest engineers. They're the ones that measure what matters and improve it relentlessly.
Want help implementing a metrics framework for your engineering team? Book a 30-minute strategy call — we'll assess your current engineering health and build a metrics roadmap tailored to your stage and team size.